[ad_1]
Over the last couple of months Europeans have once again found themselves at the centre of the COVID-19 pandemic, as the continent has been battling a second wave. Data from 21 European countries shows that over 370,000 more people than usual have died since the start of the pandemic.
These excess deaths have been very unevenly spread in geographical terms, which is why regional data is more useful than national one.

Breaking down excess deaths by when they occurred also allows us to compare the spring and autumn waves, and gives us a clearer picture of which areas the pandemic is currently hitting hardest.
Highest excess deaths yet in a third of regions
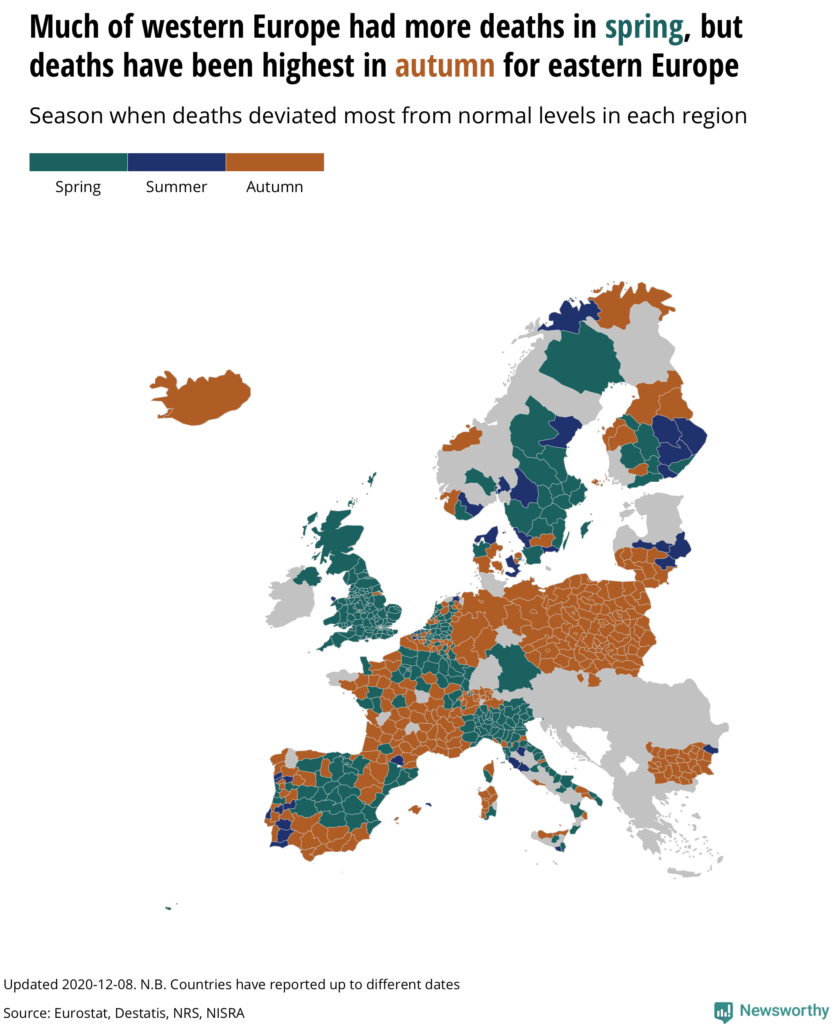
Over a third of European regions have had higher excess deaths in autumn than any other time this year. There’s a clear geographical pattern here: many countries in central and eastern Europe, for instance Poland, Czechia and Bulgaria, were spared the first wave that battered many western European countries in spring, but have now been hit hard by a second wave.
Subscribe to the Voxeurop newsletter in English

COVID-19 statistics are notoriously difficult to compare across countries, as deaths are defined and counted in very different ways. Excess deaths dodge many of these issues, and are better suited for international comparisons. However, this is also the slowest measure, with several weeks lag at best, and so full data for the latest month is yet to come in.
The turning point is taking longer to arrive
Deaths have yet to peak in several European countries, so the full picture of the second COVID-19 wave is not yet available to us, but we rather have a snapshot of the current situation. Even so, some trends are already apparent.
For one, this time the turning point has taken significantly longer to arrive. In spring this year, excess deaths started climbing rapidly at the start of March. By mid-April, some six weeks later, they had already peaked across Europe. In autumn, however, deaths across the continent did not peak until 11 weeks after they had begun increasing again in mid-September.
Excess deaths are less concentrated to few hard-hit regions
COVID-19 deaths in Europe have been higher in autumn than at any other point this year. But while the first wave hit a few regions exceptionally hard, such as Bergamo’s in Italy, our analysis shows that the impact of the virus is now more spread out.
In spring, the 50 worst affected regions in Europe accounted for nearly half of all the excess — or “abnormal” — deaths. By autumn this proportion had dropped to 30 percent.

About three in five regions have recorded excess deaths so far this autumn. This is roughly the same proportion as in the spring. But this time there are fewer regions that stand out with really high rates.
In spring, deaths were twice their normal levels in 18 regions. In Bergamo, they were three times higher than usual. By comparison, in autumn, based on the data available so far, none of the over 750 regions in our data have so far had deaths at twice as normal levels.
It bears repeating that as deaths have not yet peaked in all regions, this figure is useful to show a trend, rather than an exact value. Sweden, for instance, is reporting more cases than ever before, suggesting that the outbreak has not yet reached its peak. Meanwhile, Italy has an unusually large lag in reporting, and only has figures until the start of the autumn.
Although the full picture has not yet emerged, the data so far shows us a second wave that is less concentrated to just a few places and more evenly spread out across regions, surpassing the first one in many places.
Methodology
We have published the data behind our analysis here .
Our analysis is based on data showing daily or weekly all-cause deaths in each region, which has been collated from Eurostat and national statistical agencies (Scotland: NRS, Northern Ireland: NISRA, Germany: Destatis). A number of countries in Central and Eastern Europe have not reported any regional statistics on excess. These are excluded from this analysis.
Excess deaths have been calculated by comparing all deaths reported in a region since the start of the pandemic with the average number of deaths during that time period in the previous couple of years. We have further broken this down by season, to calculate the excess deaths in spring (weeks 10-22), summer (weeks 23-35) and autumn (weeks 36 onward).
Countries have reported up to different weeks, and we have used the latest data available. This means up to late November for most regions, but some have a larger lag in reporting. Italy, for instance, only has data available up to the beginning of October.
For most countries, the average period is 2015-19. Others have fewer years of data available, but at least two full years have been used. We have used as granular data as possible, which is NUTS3-level for most countries. However, for Germany, Scotland and Northern Ireland, comparative data is only available at NUTS1-level (making Scotland and Northern Ireland one region each, and Germany’s data broken down by its Bundesländer).
A region is defined as having had excess deaths if reported deaths were at least 5 percent higher than expected and at least 20 more deaths than usual occurred. If deaths were at least 25 percent higher than expected, we have defined it as a region with “significant excess”.
? Original article on Medium.

[ad_2]
Source link