[ad_1]
Unlike four years ago when Trump flipped many districts with large populations of white voters without a college degree, the two districts that Trump picked up this time both have large populations of Latino voters, a demographic that shifted sharply back toward Republicans in 2020 after giving Clinton historically high levels of support four years earlier.
Texas’ 23rd stands out in particular because it flipped twice over the last decade, having supported Mitt Romney in 2012. Five districts, meanwhile, showcased the opposite pattern, going for Barack Obama, then Trump, then Biden: Minnesota’s 2nd, Nevada’s 3rd, New Hampshire’s 1st, and New York’s 18th and 19th.
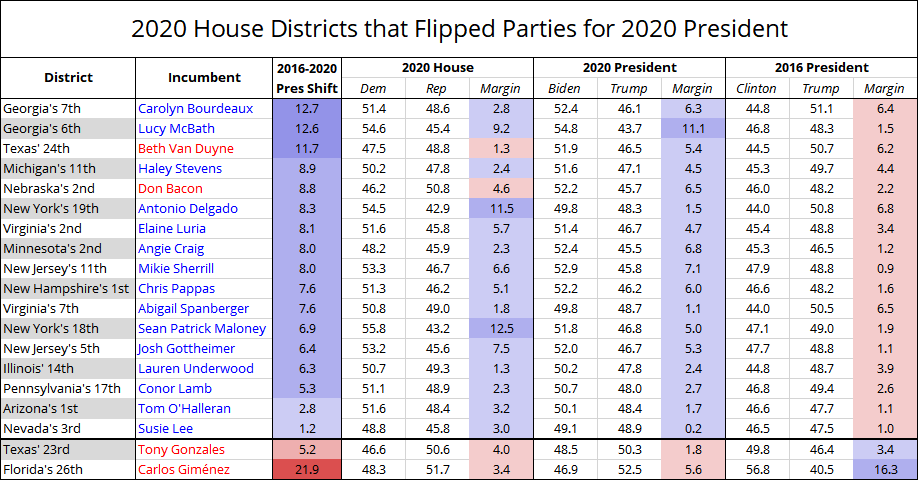
Only two of these 19 districts backed a different party at the House level compared to the top of the ticket: Nebraska’s 2nd District and Texas’ 24th District, both of which voted Biden but returned Republicans to Congress in spite of hard-fought Democratic efforts to win them last year.
In addition to the traditional map above, we have also created a cartogram below that shows every district as the same size so that dense populated districts in urban areas aren’t obscured and rural districts aren’t over-emphasized. Since many of the Trump-to-Biden districts were relatively small suburban seats geographically speaking, they become much more prominent when presented as a cartogram (click here for a larger version):

Finally, the chart below shows us who these members of Congress actually are, along with the results of the 2020 House election, 2020 and 2016 presidential elections, and a comparison between the two presidential results (a larger version is here).

You can find the election results for House and president for every district in our 117th Congress guide spreadsheet here, along with a whole host of other demographic statistics on both the districts and the members who represent them.
[ad_2]
Source link