[ad_1]
In fact, there are 25 counties and independent cities that have never supported a Democrat for president. Only a few of them are in the Midwest (although there are many Midwestern counties that haven’t voted Democratic since the 1930s or even earlier). Instead, they tend to pop up in distinct parts of Appalachia, especially eastern Tennessee and south central Kentucky. These are mountainous areas where there’s little agriculture because of the hilly terrain, but also where there wasn’t any mining and the unions that go with mining (which was what kept West Virginia and eastern Kentucky blue for so long).
Predating even the Civil War, these counties had little affinity for the wealthy planters of the lowland South who controlled the southern Democratic Party or for those elites’ interests in preserving the institution of slavery. Those resentments kept those counties voting Republican even through the New Deal era and right until now, when they’re more culturally at home in today’s Republican Party.
None of these counties are particularly populous; only one of them, Blount County in Tennessee (which is now in the exurbs of Knoxville) has over 100,000 residents. The list of counties that have never voted Democratic also lost a significant member in 2020: Riley County, Kansas, finally broke the streak. If you’re wondering why, Riley County is the home to Kansas State University; over the last few decades, education has become a more important predictor of voting Democratic, and Riley County’s level of college-educated residents is at a point where it just wasn’t likely to stay in the red column any longer.
You probably also can see the pattern where the darkest colors are—in other words, the places that are still voting Democratic (or, in the case of a lot of suburban counties, that have recently started). For the most part, it’s the nation’s major metropolitan areas. Other areas you’ll notice are the nation’s Black-majority rural areas (including the Mississippi Delta and the Black Belt that runs across Alabama and Georgia), Latino-majority areas like the Rio Grande Valley and northern New Mexico, and Native American reservations dotting the Great Plains. There are also a few remaining mostly white rural areas that are a mix of regions with a union-based, long Democratic tradition (like Minnesota’s Iron Range) or a college education-based, very short Democratic tradition (such as ski resort counties in Colorado and Idaho).
Some of the gradations are subtle, so you can also click through for an expanded view of the Democratic map. For instance, one interesting detail that you might need to zoom in on is that, unlike their neighbors in Kentucky or rural Illinois who voted for Bill Clinton in the 1990s, the rural parts of Indiana and most of Ohio have been red for much longer. In most places in those states (and in the Dakotas as well), Barry Goldwater in 1964 was the last Republican they couldn’t swallow.
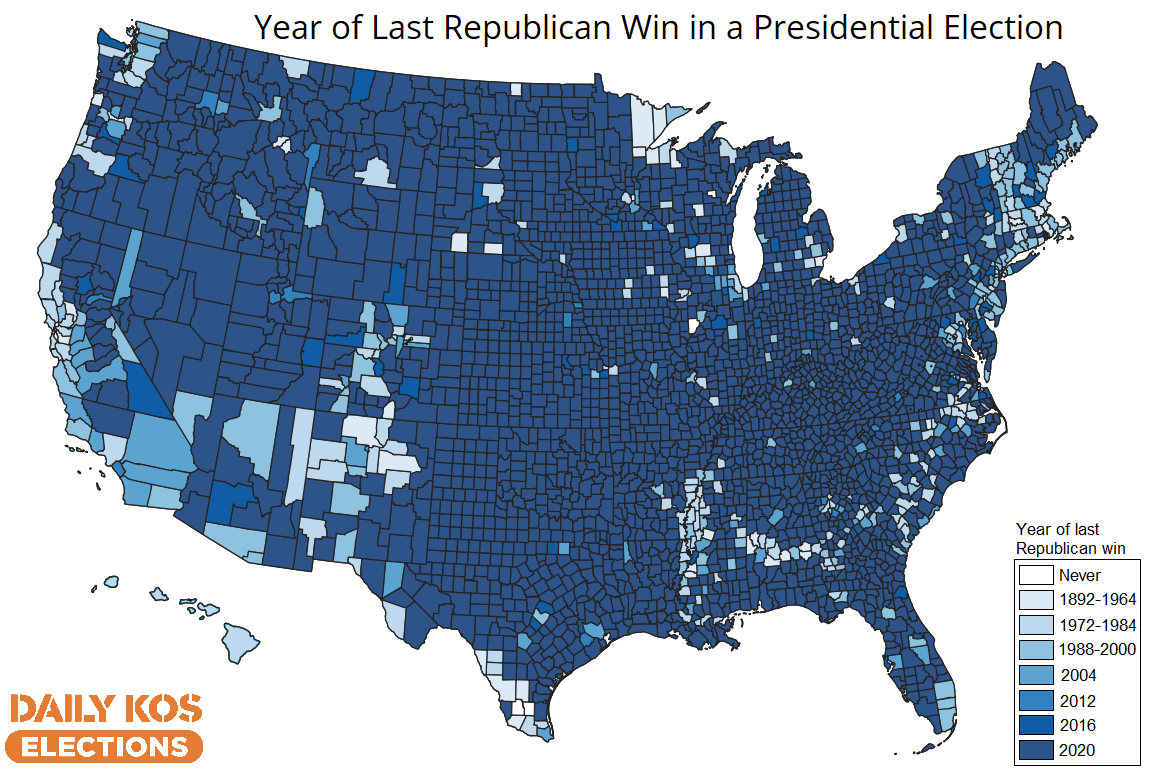
Naturally, we also have a map of the last time a Republican won each county. It’s somewhat less interesting, though, and the main reason why is that the last few decades have seen the GOP transformed into a party that’s most strong in rural areas. Republicans haven’t exactly become a primarily rural party; they still get the plurality of their votes in the suburbs, but that’s largely because that’s where a majority of the nation’s votes live.
For example, the county that gave Donald Trump more votes than any other was, as always, Los Angeles County, California—over 1.14 million votes—despite the fact that he lost the county by nearly 2 million votes, or 71-27%! That’s purely because Los Angeles County is much more populous than any other county. (By the same token, the state that’s home to the most Trump voters in the country is California.)
However, on a gradient map like this one (known as a choropleth), the rural areas show up strongest for Republicans because they win most rural counties by a wide margin, as well as the fact that the vast majority of the nation’s land mass is rural.

One thing you might notice, though, is that there’s usually a gradation between the nation’s suburban counties and the big city counties that they orbit. Most of the nation’s largest counties have been dark blue for a long time: Suffolk County (home of Boston), as well every New York City borough except for Staten Island haven’t voted Republican since 1924, while Wayne County (Detroit) hasn’t since 1928 and Philadelphia hasn’t since 1932. Major suburban counties have only shifted blue more recently: most northeastern and California suburbs didn’t vote Democratic until the Clinton era in the 1990s, and a number of southern suburbs didn’t make the move until 2016.
There are only three counties (outside of the District of Columbia) that have never voted Republican, and they’re all very tiny: two in the Rio Grande Valley in Texas (Brooks and Jim Hogg) and one in Wisconsin (Menominee) that’s coterminous with an Indian reservation. But many of the other counties in the Rio Grande Valley and in New Mexico also haven’t voted Republican in a very long time.
If you look closely, though, you’ll see one county in the Rio Grande Valley that stands out against its neighbors; that’s Zapata County, which surprised almost everyone by voting Republican in 2020—for the first time since 1920! An important caveat, however, is that Zapata County had under 4,000 votes in 2020; it’s not a difference-maker in the grand scheme of things, although it was part of a broader swing toward the GOP in the Latino vote last year.
You can click on an expanded view of the Republican map as well. Finally, you might be wondering about a particular county but one that you can’t isolate on the map, or simply want to browse the entire list of dates. To make that easier, here is a spreadsheet listing the year of the most recent win for both parties.
[ad_2]
Source link